Frequently Asked Questions
Compiled here are a set of frequently asked questions, along with answers. If you don’t find your question listed here then please feel free to add an issue on github. More questions are always welcome, and the authors will do their best to answer. If you feel you have a common question that isn’t answered here then please suggest that the question (and answer) be added to the FAQ when you file the issue.
Should I normalise my features?
The default answer is yes, but, of course, the real answer is “it depends”. If your features have meaningful relationships with one another (say, latitude and longitude vales) then normalising per feature is not a good idea. For features that are essentially independent it does make sense to get all the features on (relatively) the same scale. The best way to do this is to use pre-processing tools from scikit-learn. All the advice given there applies as sensible preprocessing for UMAP, and since UMAP is scikit-learn compatible you can put all of this together into a scikit-learn pipeline
Can I cluster the results of UMAP?
This is hard to answer well, but essentially the answer is “yes, with care”. To start with it matters what clustering algorithm you are going to use. Since UMAP does not necessarily produce clean spherical clusters something like K-Means is a poor choice. I would recommend HDBSCAN or similar. The catch here is that UMAP, with its uniform density assumption, does not preserve density well. What UMAP will do, however, is contract connected components of the manifold together. Providing you have enough data for UMAP to distinguish that information then you can get useful clustering results out since algorithms like HDBSCAN will easily pick out the components after applying UMAP.
UMAP does offer significant improvements over algorithms like t-SNE for clustering. First, by preserving more global structure and creating meaningful separation between connected components of the manifold on which the data lies, UMAP offers more meaningful clusters. Second, because it supports arbitrary embedding dimensions, UMAP allows embedding to larger dimensional spaces that make it more amenable to clustering.
The clusters are all squashed together and I can’t see internal structure
One of UMAPs goals is to have distance between clusters of points be meaningful. This means that clusters can end up spread out with a fair amount of space between them. As a result the clusters themselves can end up more visually packed together than in, say, t-SNE. This is intended. A catch, however, is that many plots (for example matplotlib’s scatter plot with default parameters) tend to show the clusters only as indistinct blobs with no internal structure. The solution for this is really a matter of tuning the plot more than anything else.
If you are using matplotlib consider using the s parameter
that specifies the glyph size in scatter plots. Depending on
how much data you have reducing this to anything from 5 to
0.001 can have a notable effect. The size parameter in
bokeh is similarly useful (but does not need to be quite so small).
More generally the real solution, particular with large datasets, is to use datashader for plotting. Datashader is a plotting llibrary that handles aggregation of large scale data in scatter plots in a way that can better show the underlying detail that can otherwise be lost. We highly recommend investing the time to learn datashader for UMAP plot particularly for larger datasets.
I ran out of memory. Help!
For some datasets the default options for approximate
nearest neighbor search can result in excessive memory use.
If your dataset is not especially large but you have found
that UMAP runs out of memory when operating on it consider
using the low_memory=True option, which will switch
to a slower but less memory intensive approach to computing
the approximate nearest neighbors. This may alleviate your
issues.
UMAP is eating all my cores. Help!
If run without a random seed UMAP will use numba’s parallel
implementation to do multithreaded work and use many cores.
By default this will make use of as many cores as are available.
If you are on a shared machine or otherwise don’t wish to
use all the cores at once you can restrict the number of
threads that numba uses by making use of the environment
variable NUMBA_NUM_THREADS; see the numba
documentation
for more details.
Is there GPU or multicore-CPU support?
There is basic multicore support as of version 0.4. In the future it is possible that GPU support may be added.
There is a UMAP implementation for GPU available in the NVIDIA RAPIDS cuML library, so if you need GPU support that is currently the best palce to go.
Can I add a custom loss function?
To allow for fast performance the SGD phase of UMAP has been hand-coded for the specific needs of UMAP. This makes custom loss functions a little difficult to handle. Now that Numba (as of version 0.38) supports passing functions it is posisble that future versions of UMAP may support such functionality. In the meantime you should definitely look into smallvis, a library for t-SNE, LargeVis, UMAP, and related algorithms. Smallvis only works for small datasets, but provides much greater flexibility and control.
Is there support for the R language?
Yes! A number of people have worked hard to make UMAP available to R users.
If you want to use the reference implementation under the hood but want a nice R interface then we recommend umap, which wraps the python code with reticulate. Another reticulate interface is umapr, but it may not be under active development.
If you want a pure R version then we recommend uwot at this time. umap also provides a pure R implementation in addition to its reticulate wrapper.
Both umap and uwot are available on CRAN.
Is there a C/C++ implementation?
Not that we are aware of. For now Numba has done a very admirable job of providing high performance and the developers of UMAP have not felt the need to move to lower level languages. At some point a multithreaded C++ implementation may be made available, but there are no time-frames for when that would happen.
I can’t get UMAP to run properly!
There are, inevitably, a number of issues and corner cases that can cause issues for UMAP. Some know issues that can cause problems are:
- UMAP doesn’t currently support 32-bit Windows. This is due to issues with Numba of that platform and will not likely be resolved soon. Sorry :-(
- If you have pip installed the package
umapat any time (instead ofumap-learn) this can cause serious issues. You will want to purge/remove everything umap related in yoursite-packagesdirectory and re-installumap-learn. - Having any files called
umap.pyin the current directory you will have issues as that will be loaded instead of theumapmodule.
It is worth checking the issues page on github for potential solutions. If all else fails please add an issue on github.
What is the difference between PCA / UMAP / VAEs?
This is an example of an embedding for a popular Fashion MNIST dataset.
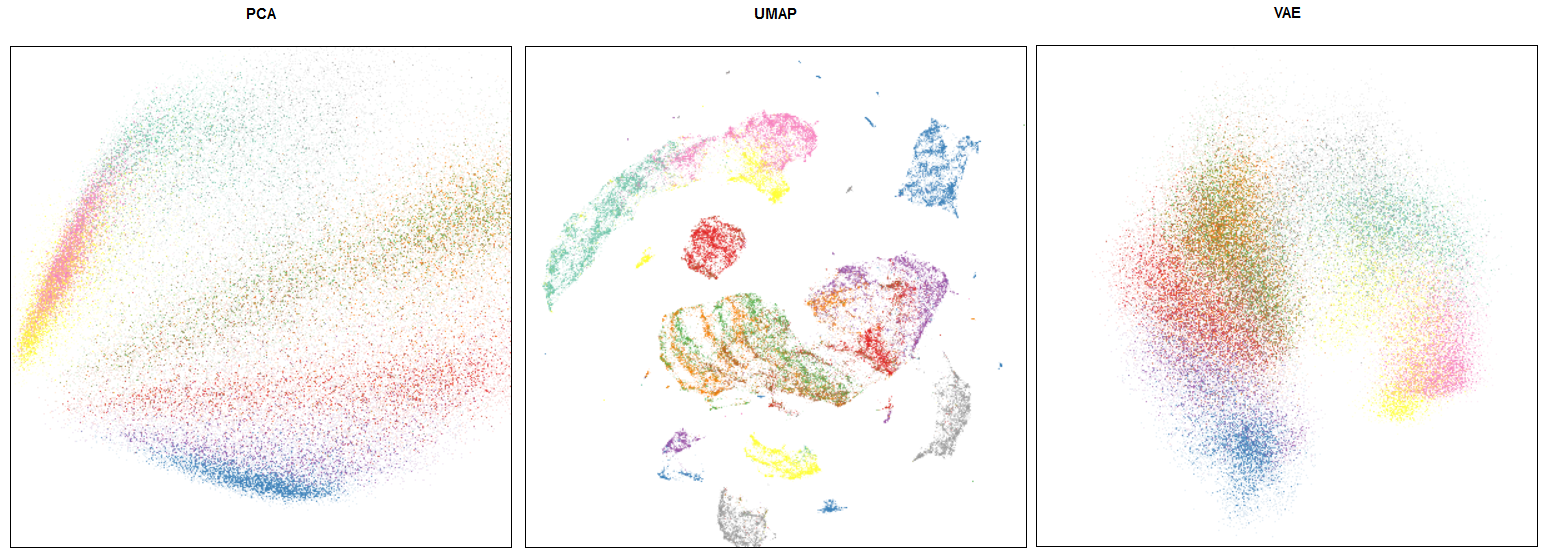
Comparison of PCA / UMAP / VAE embeddings
Note that FMNIST is mostly a toy dataset (MNIST on steroids). On such a simplistic case UMAP shows distillation results (i.e. if we use its embedding in a downsteam task like classification) comparable to VAEs, which are more computationally expensive.
By definition:
- PCA is linear transformation, you can apply it to mostly any kind of data in an unsupervised fashion. Also it works really fast. For most real world tasks its embeddings are mostly too simplistic / useless.
- VAE is a kind of encoder-decoder neural network, trained with KLD loss and BCE (or MSE) loss to enforce the resulting embedding to be continuous. VAE is and extension of auto-encoder network, which by design should produce embeddings that are not only relevant to actually encoding the data, but are also smooth.
From a more practical standpoint:
- PCA mostly works for any reasonable dataset on a modern machine. (up to tens or hundreds of millions of rows);
- VAEs have been shown to work only for toy datasets and to our knowledge there was no real life useful application to a real world sized dataset (i.e. ImageNet);
- Applying UMAP to real world tasks usually provides a good starting point for downstream tasks (data visualization, clustering, classification) and works reasonably fast;
- Consider a typical pipeline: high-dimensional embedding (300+) => PCA to reduce to 50 dimensions => UMAP to reduce to 10-20 dimensions => HDBSCAN for clustering / some plain algorithm for classification;
Which tool should I use?
- PCA for very large or high dimensional datasets (or maybe consider finding a domain specific matrix factorization technique, e.g. topic modelling for texts);
- UMAP for smaller datasets;
- VAEs are mostly experimental;
Where can I learn more?
- While PCA is ubiqutous, you may look at this example comparing PCA / UMAP / VAEs;
Successful use-cases
UMAP can be / has been Successfully applied to the following domains:
- Single cell data visualization in biology;
- Mapping malware based on behavioural data;
- Pre-processing phrase vectors for clustering;
- Pre-processing image embeddings (Inception) for clustering;
and many more – if you have a successful use-case please submit a pull request adding it to this list!