Interactive Visualizations
UMAP has found use in a number of interesting interactive visualization projects, analyzing everything from images from photo archives, to word embedding, animal point clouds, and even sound. Sometimes it has also been used in interesting interactive tools that simply help a user to get an intuition for what the algorithm is doing (by applying it to intuitive 3D data). Below are some amazing projects that make use of UMAP.
UMAP Zoo
An exploration of how UMAP behaves when dimension reducing point clouds of animals. It is interactive, letting you switch between 2D and 3D representations and has a wide selection of different animals. Attempting to guess the animal from the 2D UMAP representation is a fun game. In practice this tool can go a long way to helping to build at least some intuitions for what UMAP tends to do with data.
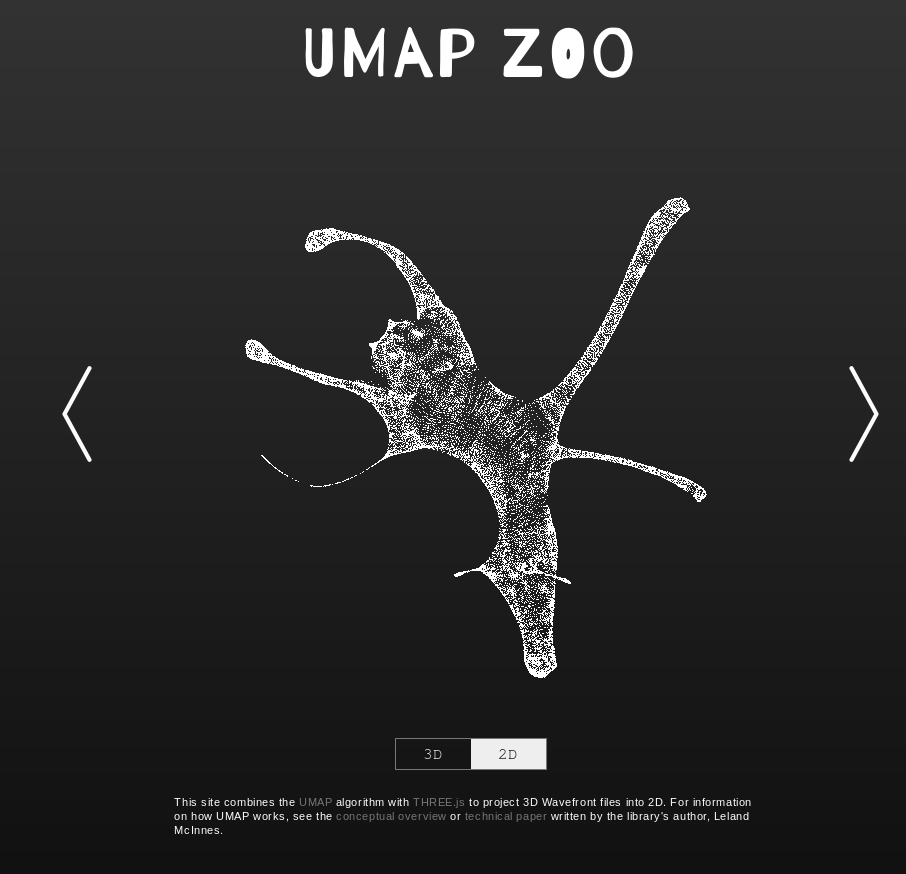
Thanks to Douglas Duhaime.
Tensorflow Embedding Projector
If you just want to explore UMAP embeddings of datasets then the Embedding Projector from Tensorflow is a great way to do that. As well as having a good interactive 3D view it also has facilities for inspecting and searching labels and tags on the data. By default it loads up word2vec vectors, but you can uplod any data you wish. You can then select the UMAP option among the tabs for embeddings choices (alongside PCA and t-SNE).
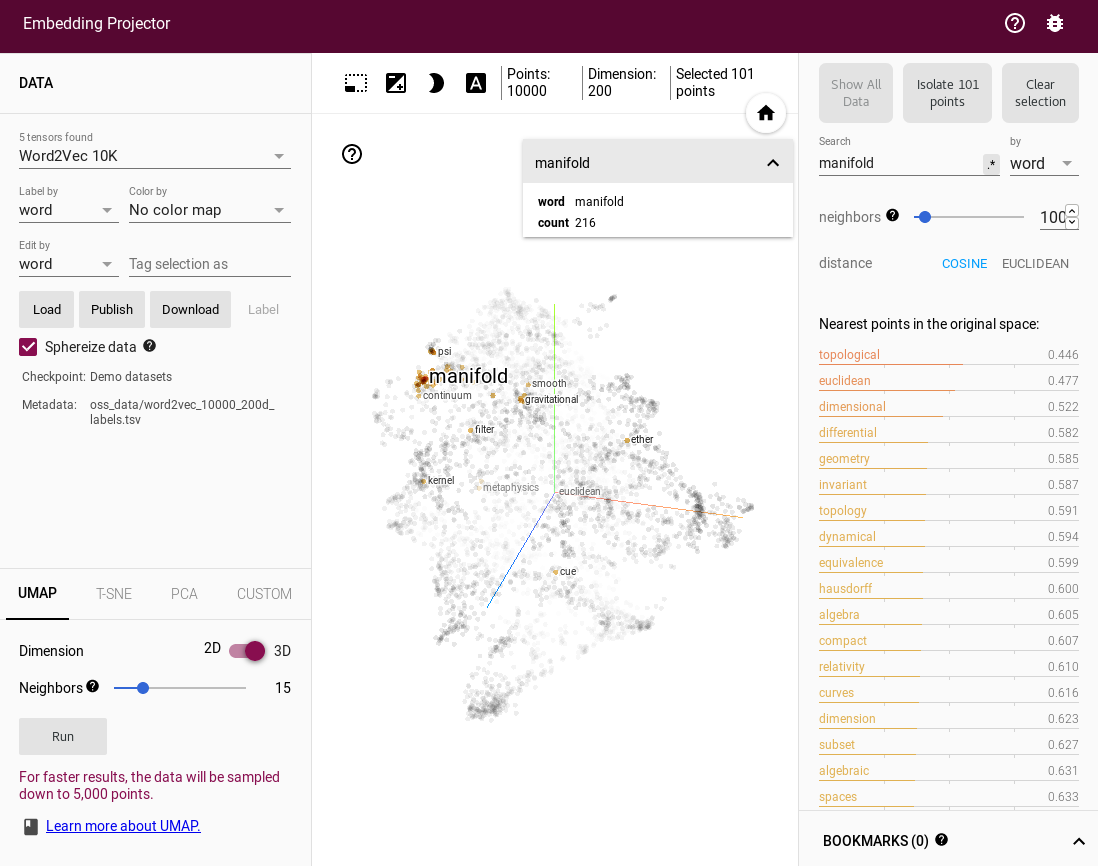
Thanks to Andy Coenen and the Embedding Projector team.
PixPlot
PixPlot provides an overview of large photo-collections. In the demonstration app from Yale’s Digital Humanities lab it provides a window on the Meserve-Kunhardt Collection of historical photographs. The approach uses convolutional neural nets to reduce the images to 2048 dimensions, and then uses UMAP to present them in a 2-dimensional map which the user can interactive pan and zoom around in. This process results in similar photos ending up in similar regions of the map allowing for easy perusal of large photo collections. The PixPlot project is also available on github in case you wish to train it on your own photo collection.
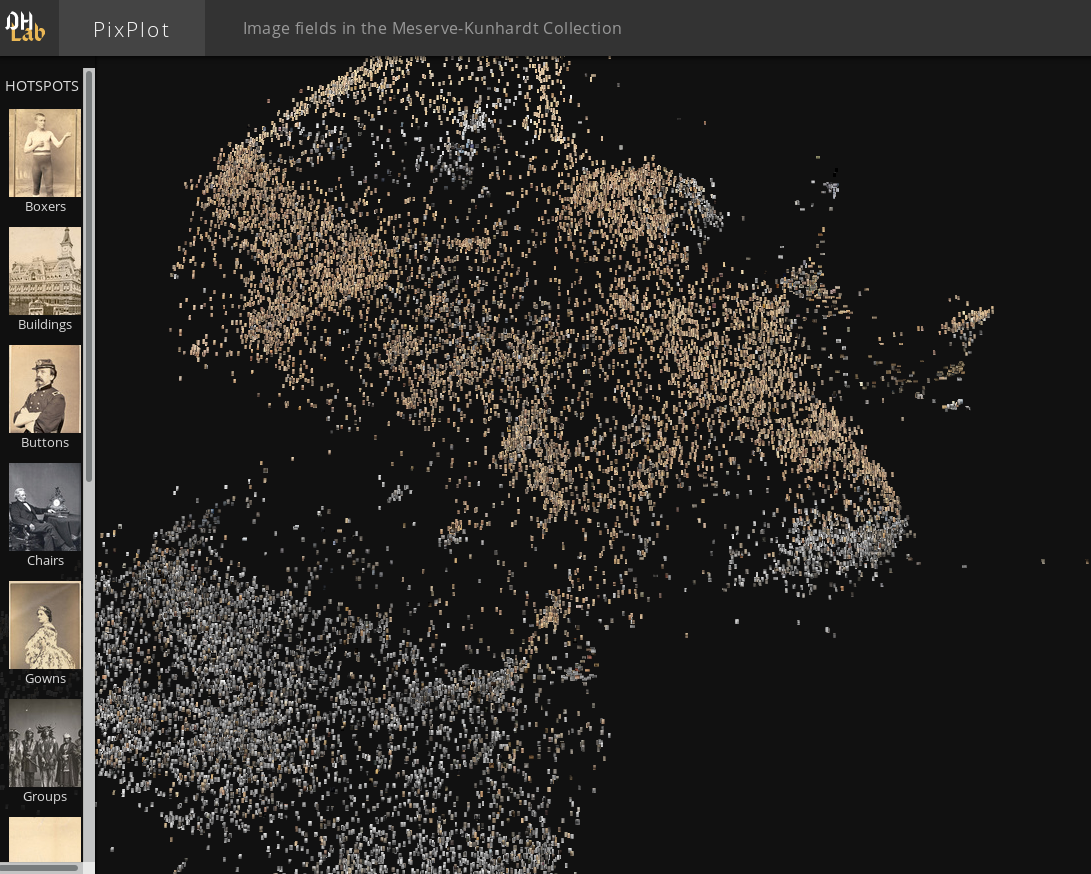
Thanks to Douglas Duhaime and the Digital Humanities lab at Yale.
UMAP Explorer
A great demonstration of building a web based app for interactively exploring a UMAP embedding. In this case it provides an exploration of UMAP run on the MNIST digits dataset. Each point in the embeddijng is rendered as the digit image, and coloured according to the digit class. Mousing over the images will make them larger and provide a view of the digit in the upper left. You can also pan and zoom around the emebdding to get a better understanding of how UMAP has mapped the different styles of handwritten digits down to 2 dimensions.
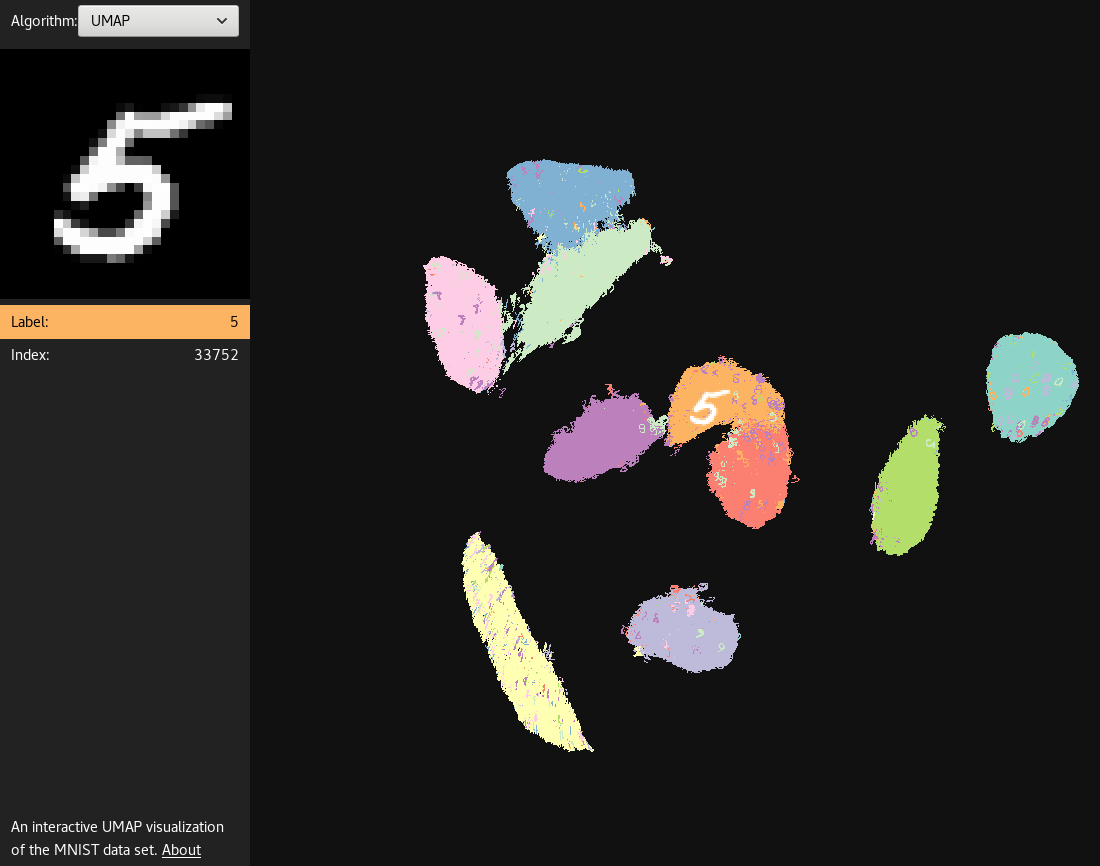
Thanks for Grant Custer.
Audio Explorer
The Audio Explorer uses UMAP to embed sound samples into a 2 dimensional space for easy exploration. The goal here is to take a large library of sounds samples and put similar sounds in similar regions of the map, allowing a user to quickly mouse over and listen to various variations of a given sample to quickly find exactly the right sound sample to use. Audio explorer uses MFCCs and/or WaveNet to provide an initial useful vector representation of the sound samples, before applying UMAP to generate the 2D embedding.
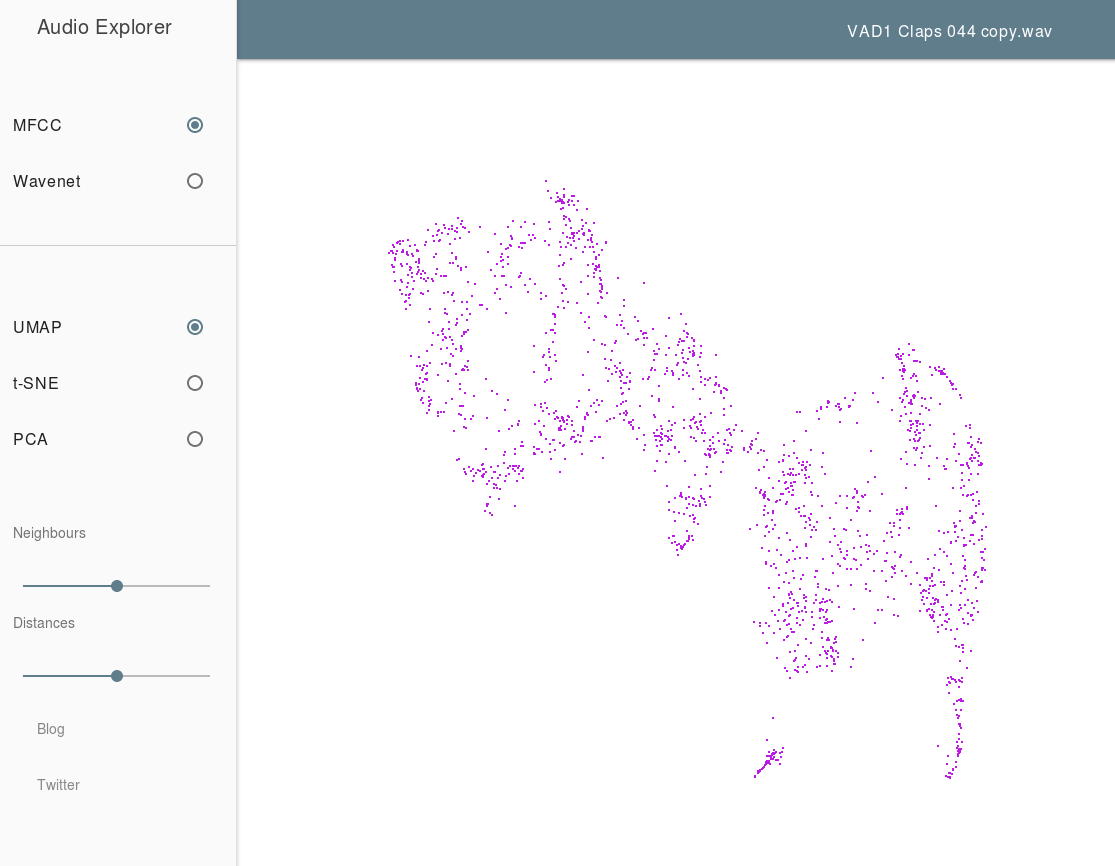
Thanks to Leon Fedden.